Collateralized loan obligations (“CLOs”) have a multi-decade track record of withstanding market shocks including the global financial crisis (GFC), global energy crisis, COVID-19, and 2022 volatility.
- Since 2013, the average annual CLO equity distribution for deals in reinvestment period is ~16%1
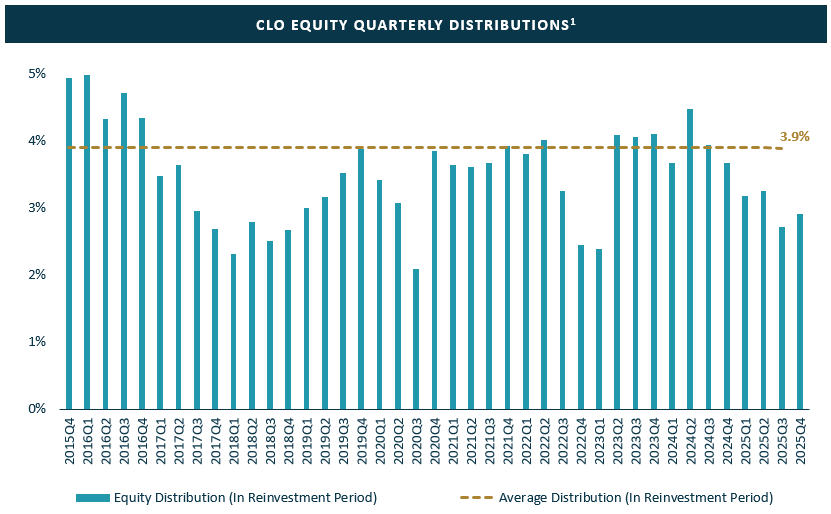
Past performance is not a guarantee of future results. For illustrative purposes only. There is no guarantee these trends will continue. Performance shown on this slide is across the entire CLO equity market. 1) BAML Research as of January 31, 2026. Average Distribution (In Reinvestment Period) is the average of Median Quarterly Equity Distribution (In Reinvestment Period).
- CLOs consist of diversified portfolios of broadly syndicated, liquid, senior secured corporate loans with an average facility size of ~$1.1bn 5
- Each CLO typically has more than 200 distinct loans diversified across a wide range of industries.
- Loans are senior to bonds and equity with first priority to underlying collateral pledged by the borrower. As a result, loans have a historical high recovery rate of 62%2
- Since inception in 1997, the LSTA Leveraged Loan Index has only had 3 years of negative returns3
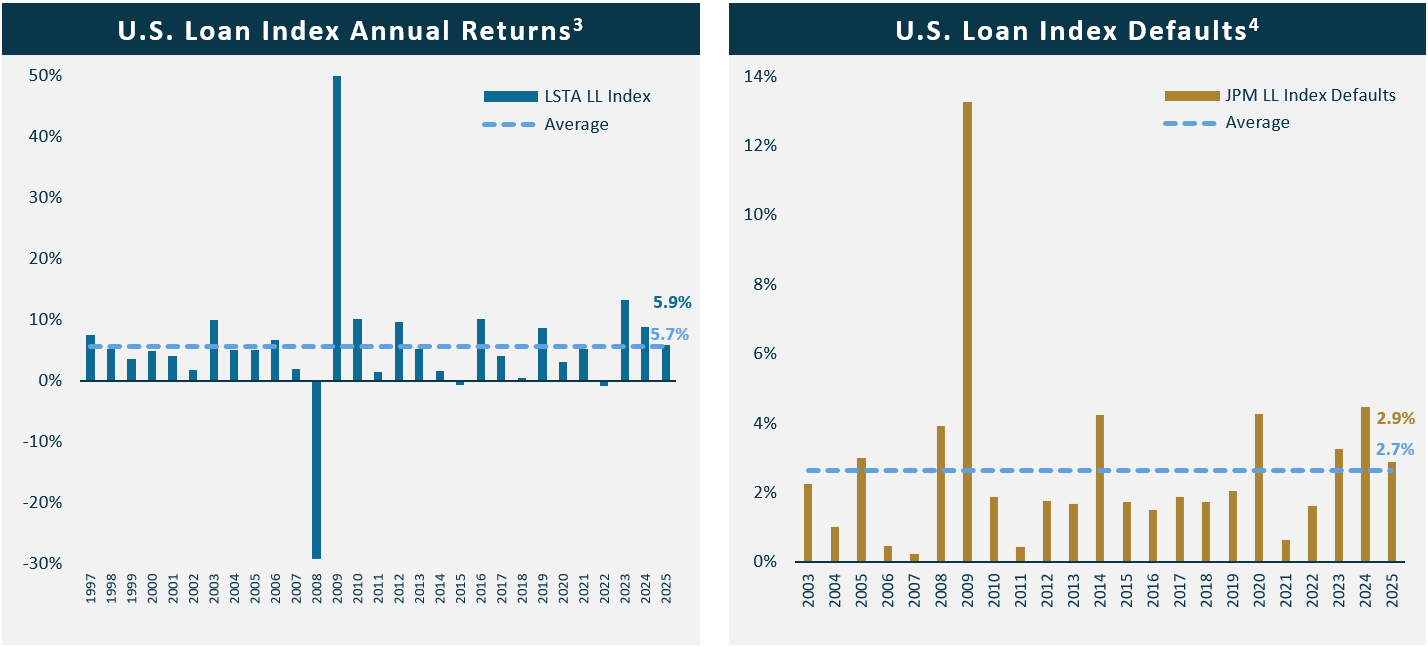
For illustrative purposes only. Past performance is not indicative of future results. 2) Moody’s Investor Services. CLO data from 1983 – 2024 and corporate debt data from 1983 – 2024. 3) LSTA as of December 31, 2025. 4) J.P. Morgan Research Default Monitor from January 1, 2003 to December 31, 2025. Based on par amount. Includes distressed exchanges. 5) For illustrative purposes only. Past performance is not indicative of future results. LCD, Comps Index Components as of December 31, 2025.
- The U.S. CLO market is over $1 trillion in size today and continues to grow, including record 2025 issuance6
- The LSTA U.S. Leveraged Loan Index has grown from $1.2 trillion to $1.5 trillion over the last five years.6 Since CLOs account for over 60% of the U.S. leveraged loan market, the growth of the loan market creates a need for CLO creation.7
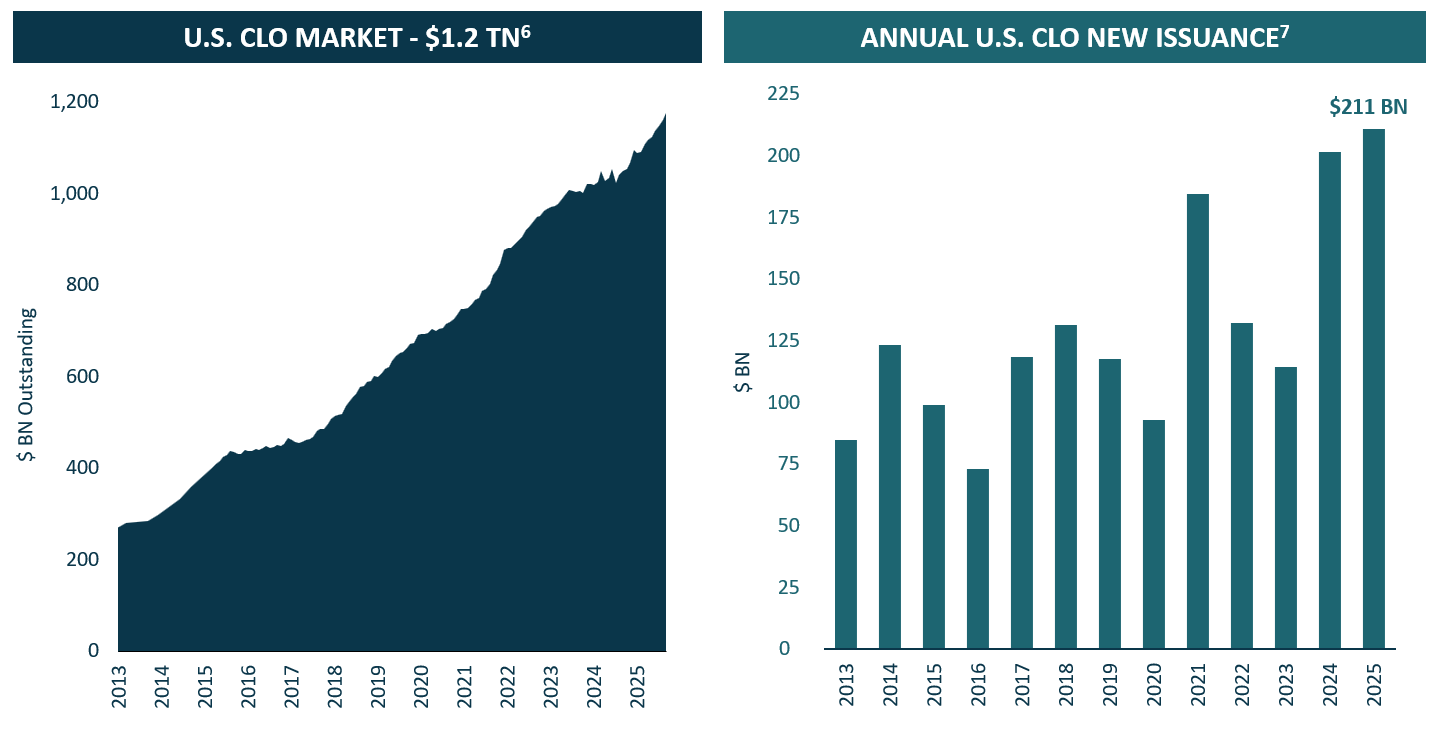
6) Citi Research as of December 31, 2025. There can be no guarantee that these trends will continue. 7) LCD as of December 31, 2025.
- CLOs have long-term financing (typically 13 years)
- CLOs generally are not subject to covenants requiring margin calls or forced liquidations triggered by decreases in the value of collateral.
- CLOs are actively managed vehicles with five year reinvestment periods
- Reinvestment allows for ongoing portfolio optimization
- Since financing is locked-in for an extended period, CLOs benefit from volatility as they can purchase loans at discounted prices and / or higher spreads to increase returns
- Detailed monthly reporting provided by an independent trustee
- Reports include name-by-name positions in the CLO and calculations of required tests
1BAML Research as of January 31, 2026. Average Distribution (In Reinvestment Period) is the average of Median Quarterly Equity Distribution (In Reinvestment Period).
2 Moody's Investor Services. CLO data from 1983 – 2024 and corporate debt data from 1983 – 2024.
3 LSTA as of December 31, 2025.
4 J.P. Morgan Research Default Monitor from January 1, 2003 to December 31, 2025. Based on par amount. Includes distressed exchanges.
5 LCD, Comps Index Components as of December 31, 2025.
6 Citi Research as of December 31, 2025. There can be no guarantee that these trends will continue.
7 CD as of December 31, 2025.